What is Power BI?
Power BI is a business analytics tool developed by Microsoft. It allows users to visualize their data and share insights across an organization or embed them in an app or website. Power BI offers robust, self-service data analysis capabilities and is widely used for creating reports and dashboards, making it a popular tool in the field of data analysis and business intelligence.
Power BI Desktop or Service?
Power BI Desktop is a free, Windows-based application primarily used for creating and developing reports. You can connect to multiple data sources, transform data using Power Query, and create data models. Users can create complex, interactive reports using various visualizations. It provides robust data transformation and cleansing capabilities. Users can write DAX (Data Analysis Expressions) formulas for calculated columns and measures.
Power BI Service is a cloud-based platform used for creating, sharing, collaborating, and distributing reports. Allows publishing reports created in Power BI Desktop to the cloud. Once published, reports can be shared and accessed by others. You can create dashboards by pinning visuals from multiple reports into a single, high-level view. You can schedule automatic data refreshes from cloud and on-premises data sources. Reports and dashboards can be shared with stakeholders across the organization for viewing, collaborating, and receiving real-time insights. Users can organize their content into workspaces and publish collections of reports and dashboards as apps for specific audiences.
More information is on the Microsoft website.
https://learn.microsoft.com/en-us/power-bi/fundamentals/service-service-vs-desktop
Downloading Power BI:
The desktop version can be downloaded on the following link:
https://www.microsoft.com/en-us/power-platform/products/power-bi/downloads

Installation is very straightforward. You can leave everything on default if you are not sure what to do.
How to Turn On On-Object Interaction in Power BI:
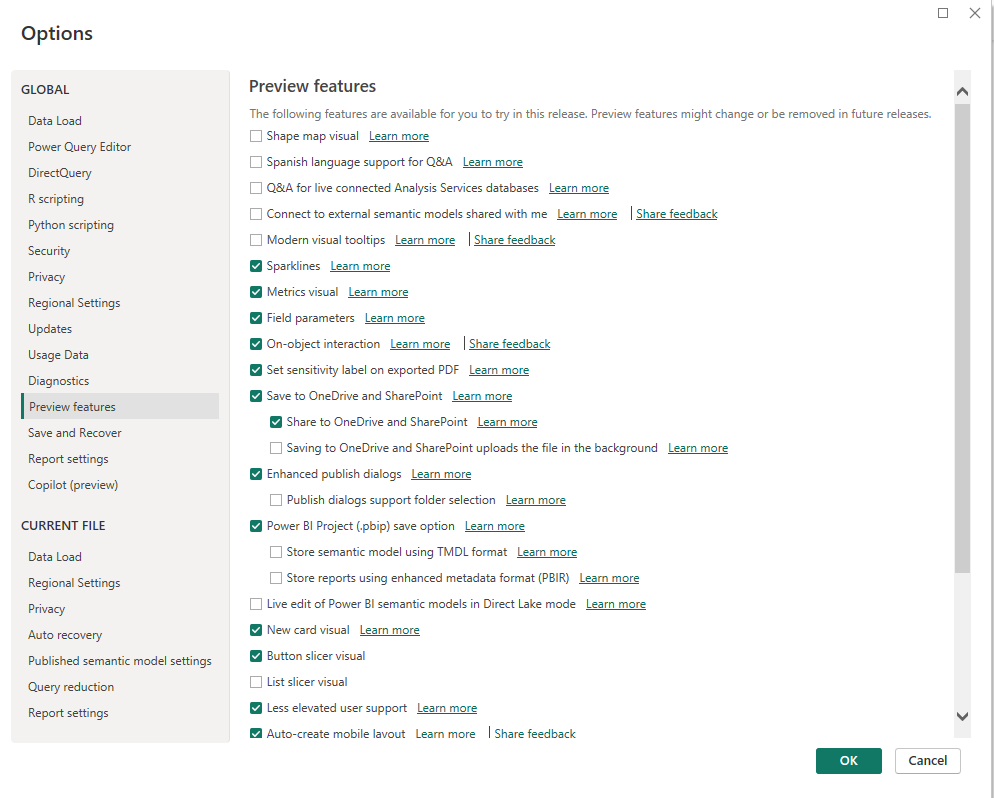
I highly recommend that learners turn one setting option on. On-Object Interaction is a feature in Power BI that allows users to directly interact with visuals and their properties without navigating away to the side panes or separate formatting options. Imagine clicking on a bar chart in your report and immediately seeing options to change colors, labels, or titles right on the chart. Instead of navigating away to the Format pane on the right side, you can quickly make adjustments directly on the visual itself.
- Go to the “File” tab in the upper left corner and select “Options and Settings”, then choose “Options”.
- In the Options window, under “Preview features”, look for a feature named “On-Object Interaction”
- Check the box next to “On-Object Interaction” to enable it.
- Click “OK” and restart Power BI Desktop for the changes to take effect.

Conclusion
Congratulations on setting up Power BI! You’ve taken the first step towards harnessing the power of data analysis and visualization. With Power BI installed and ready to go, you can start exploring its features, connecting to your data sources, and creating insightful reports and dashboards.
Stay tuned for more tutorials and tips on using Power BI effectively.
If you have any questions or run into issues, feel free to leave a comment below, and I’ll be happy to help! Happy analyzing!